Technical aspects of the data
This part might seem to be too technical for readers who are mainly interested in the results. The reason why this page exists is that the information here can be essential for the analysts working with the data.
The inspectdf package is used to generate the visualizations in this page.
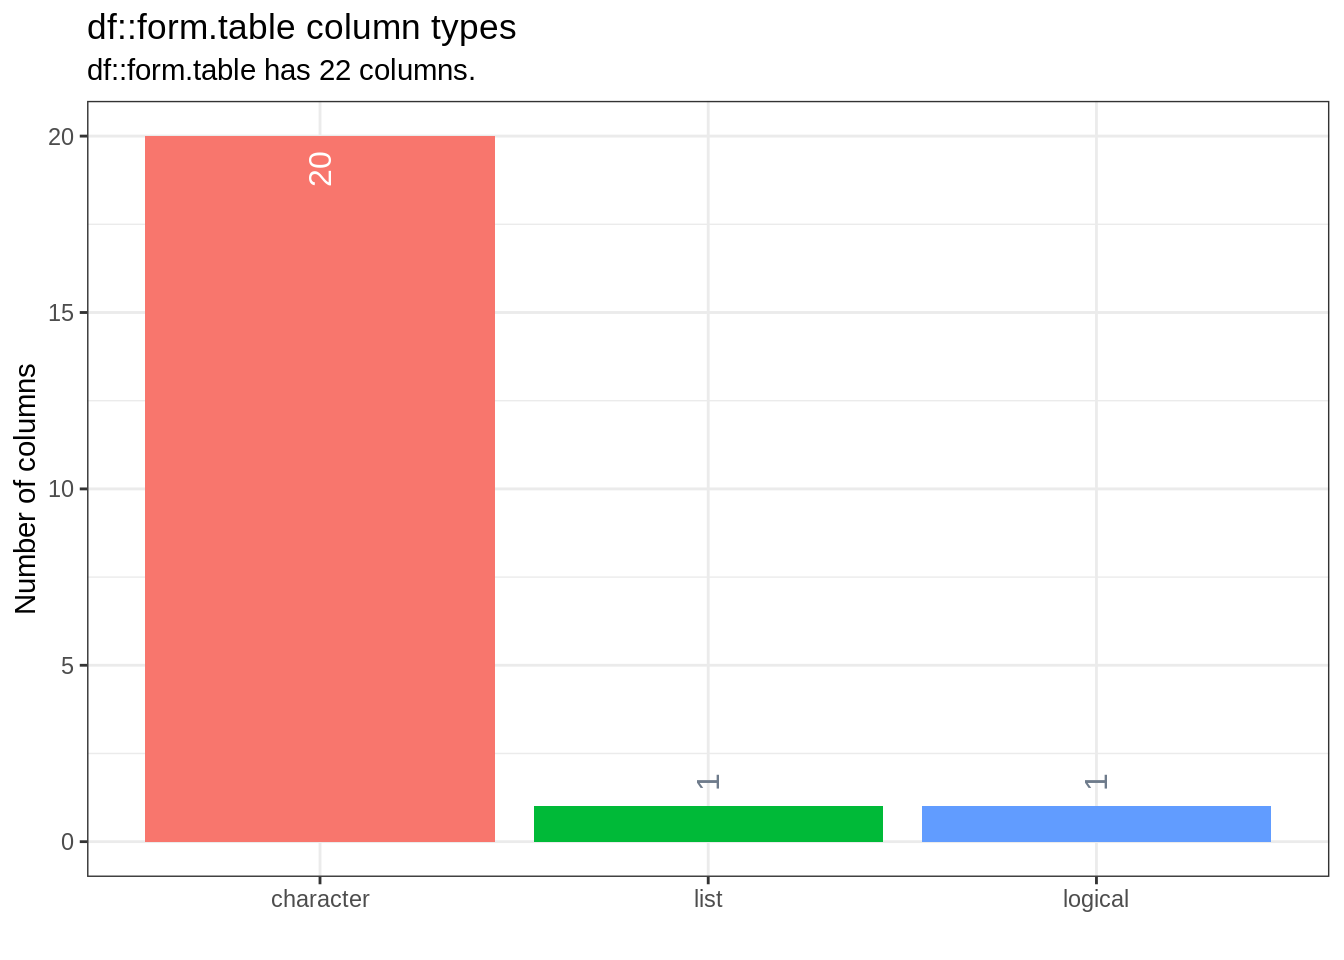
Figure 3: The column types in the data frame
- Almost all columns are character vector, except required.
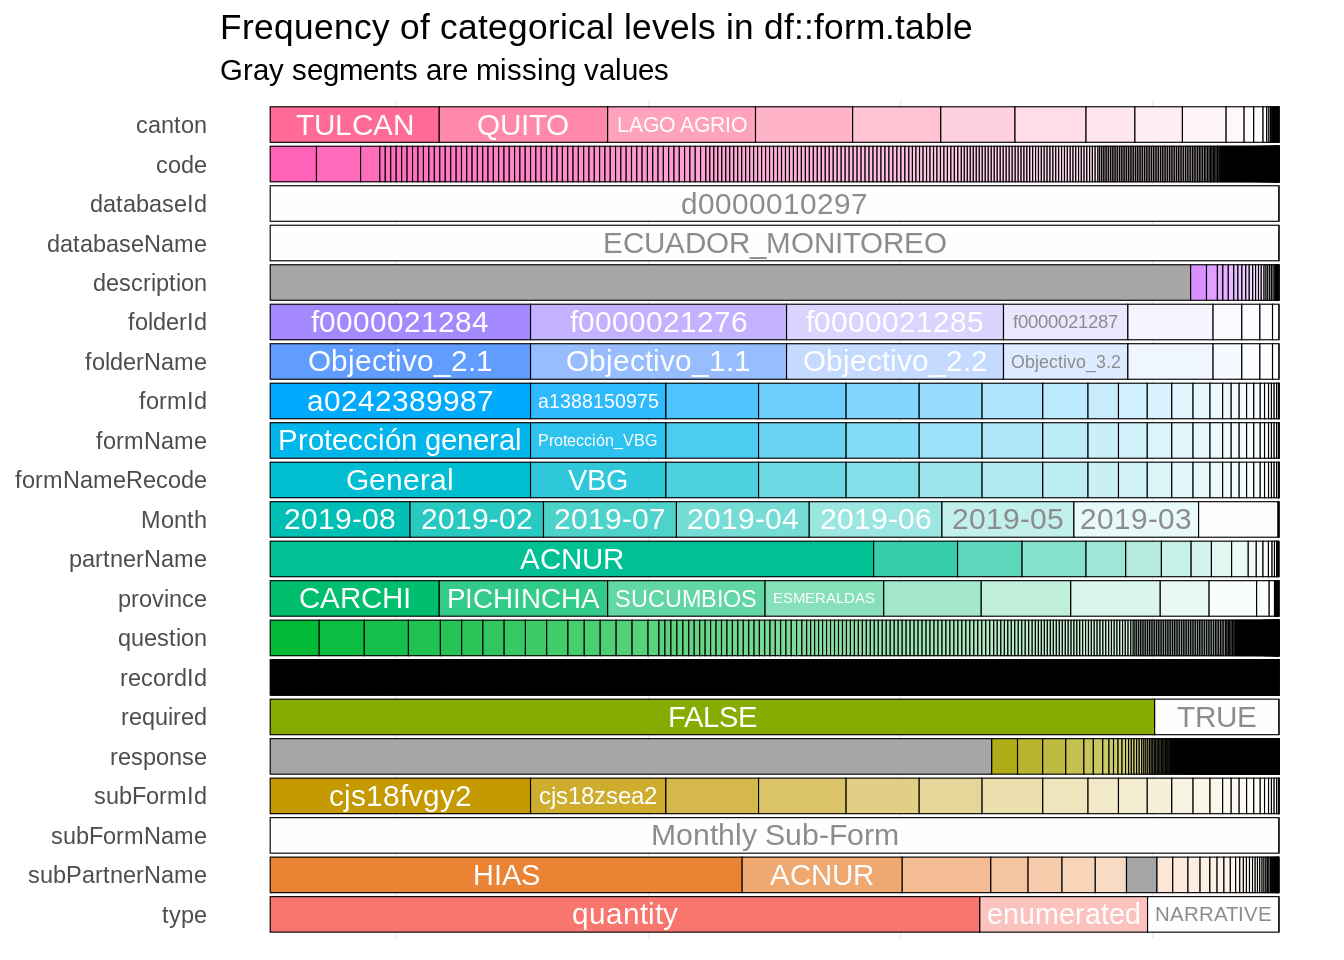
Figure 4: Summarising categorical features in the data frame
- We see that the response field has many unique levels which has a solid color in the chart.
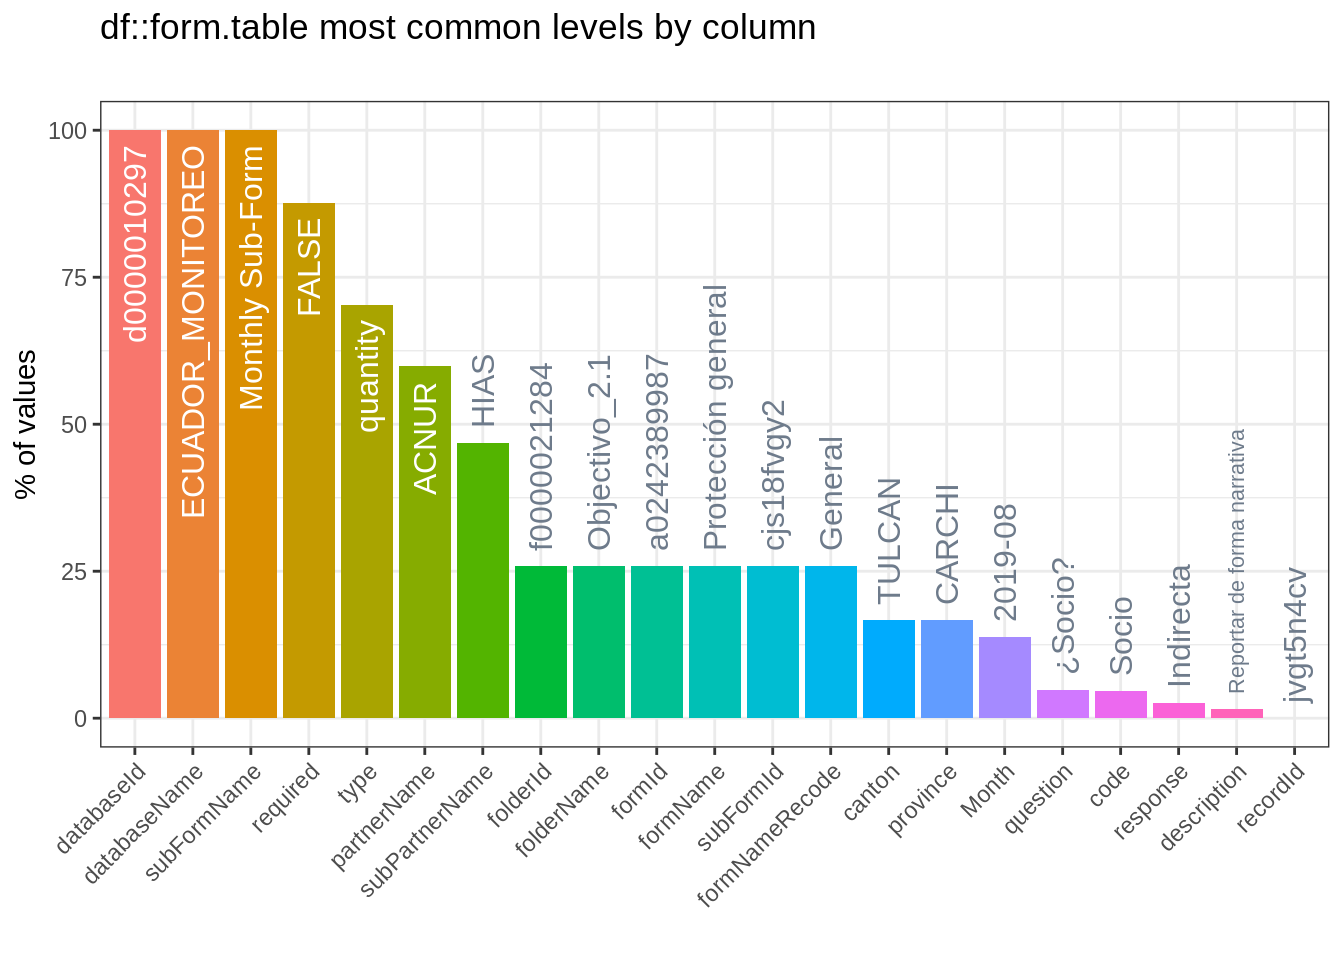
Figure 5: See the most frequently occurring categorical level in each column.
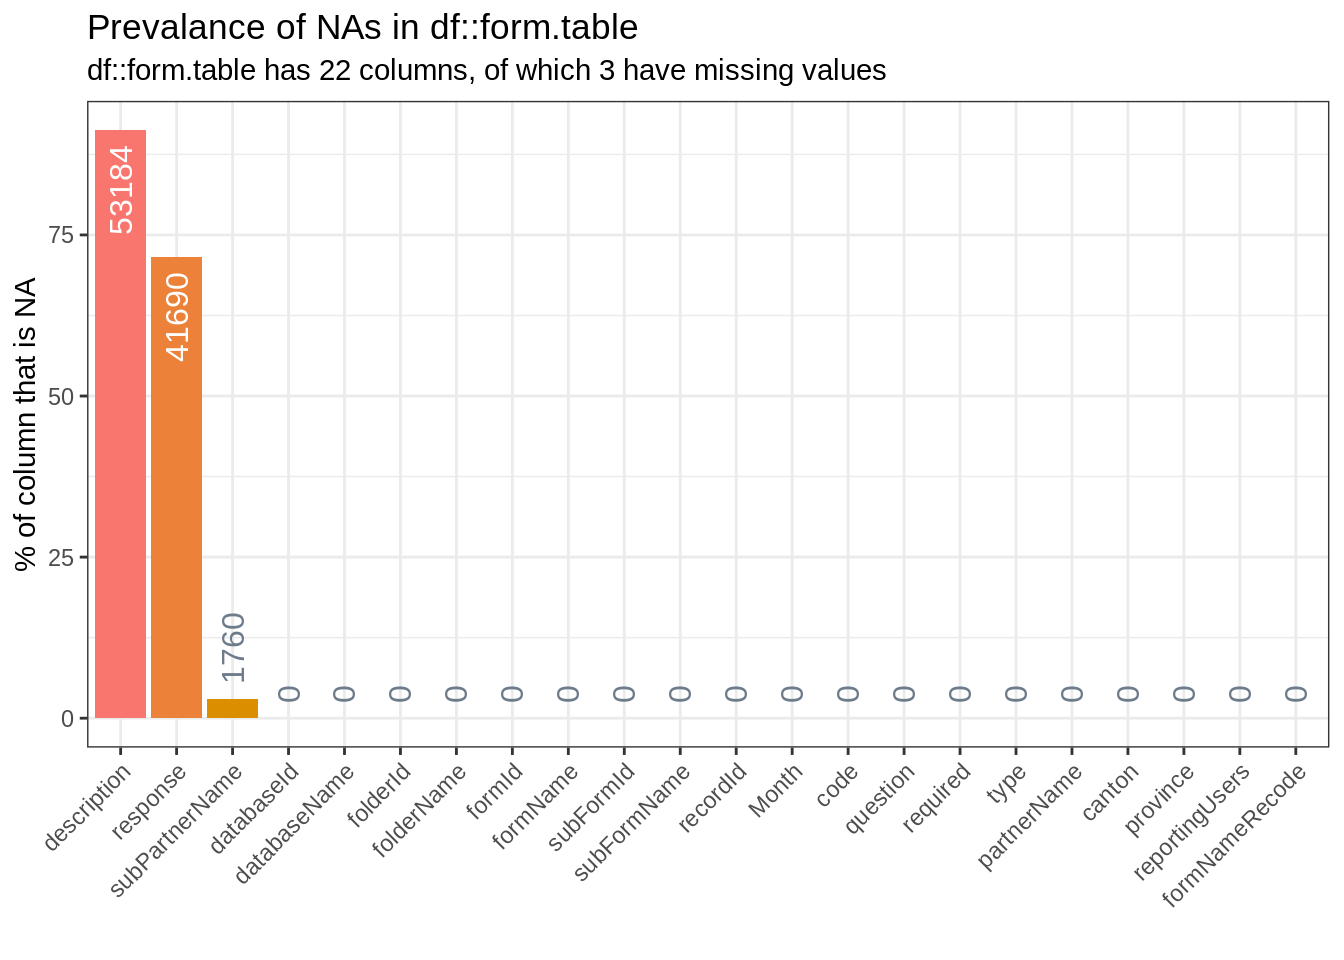
Figure 6: The prevalance of NAs (missing values) in the colums.
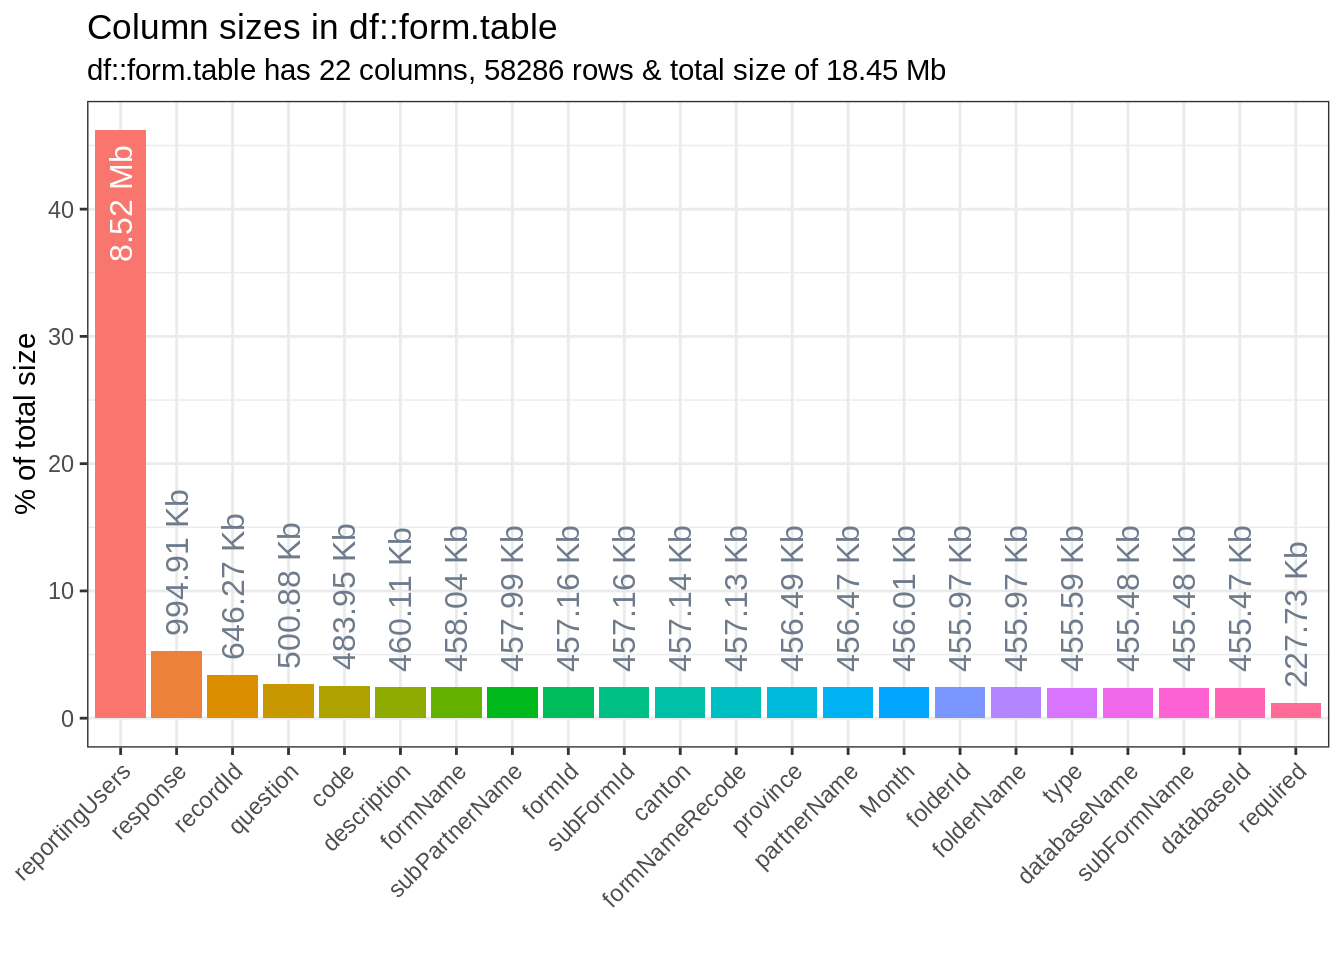
Figure 7: The size of each column in the data frame.
- As seen in the plot, the response column has the most size because it holds long text fields.
Look at below to have a glimpse of the raw data.
## # A tibble: 5 x 22
##   databaseId databaseName folderId folderName formId formName subFormId
##   <chr>      <chr>        <chr>    <chr>      <chr>  <chr>    <chr>
## 1 d00000102… ECUADOR_MON… f000002… Objectivo… a1424… Salud    cjs13y74…
## 2 d00000102… ECUADOR_MON… f000002… Objectivo… a1424… Salud    cjs13y74…
## 3 d00000102… ECUADOR_MON… f000002… Objectivo… a1424… Salud    cjs13y74…
## 4 d00000102… ECUADOR_MON… f000002… Objectivo… a1424… Salud    cjs13y74…
## 5 ...        ...          ...      ...        ...    ...      ...
## # … with 15 more variables: subFormName <chr>, recordId <chr>,
## #   Month <chr>, code <chr>, question <chr>, required <chr>, type <chr>,
## #   partnerName <chr>, canton <chr>, province <chr>,
## #   reportingUsers <list>, description <chr>, response <chr>,
## #   formNameRecode <chr>, subPartnerName <chr>