Which sectors do receive high word counts in responses?
A rule of thumb is to know the distributions separated by the major category, which is here the sector name.
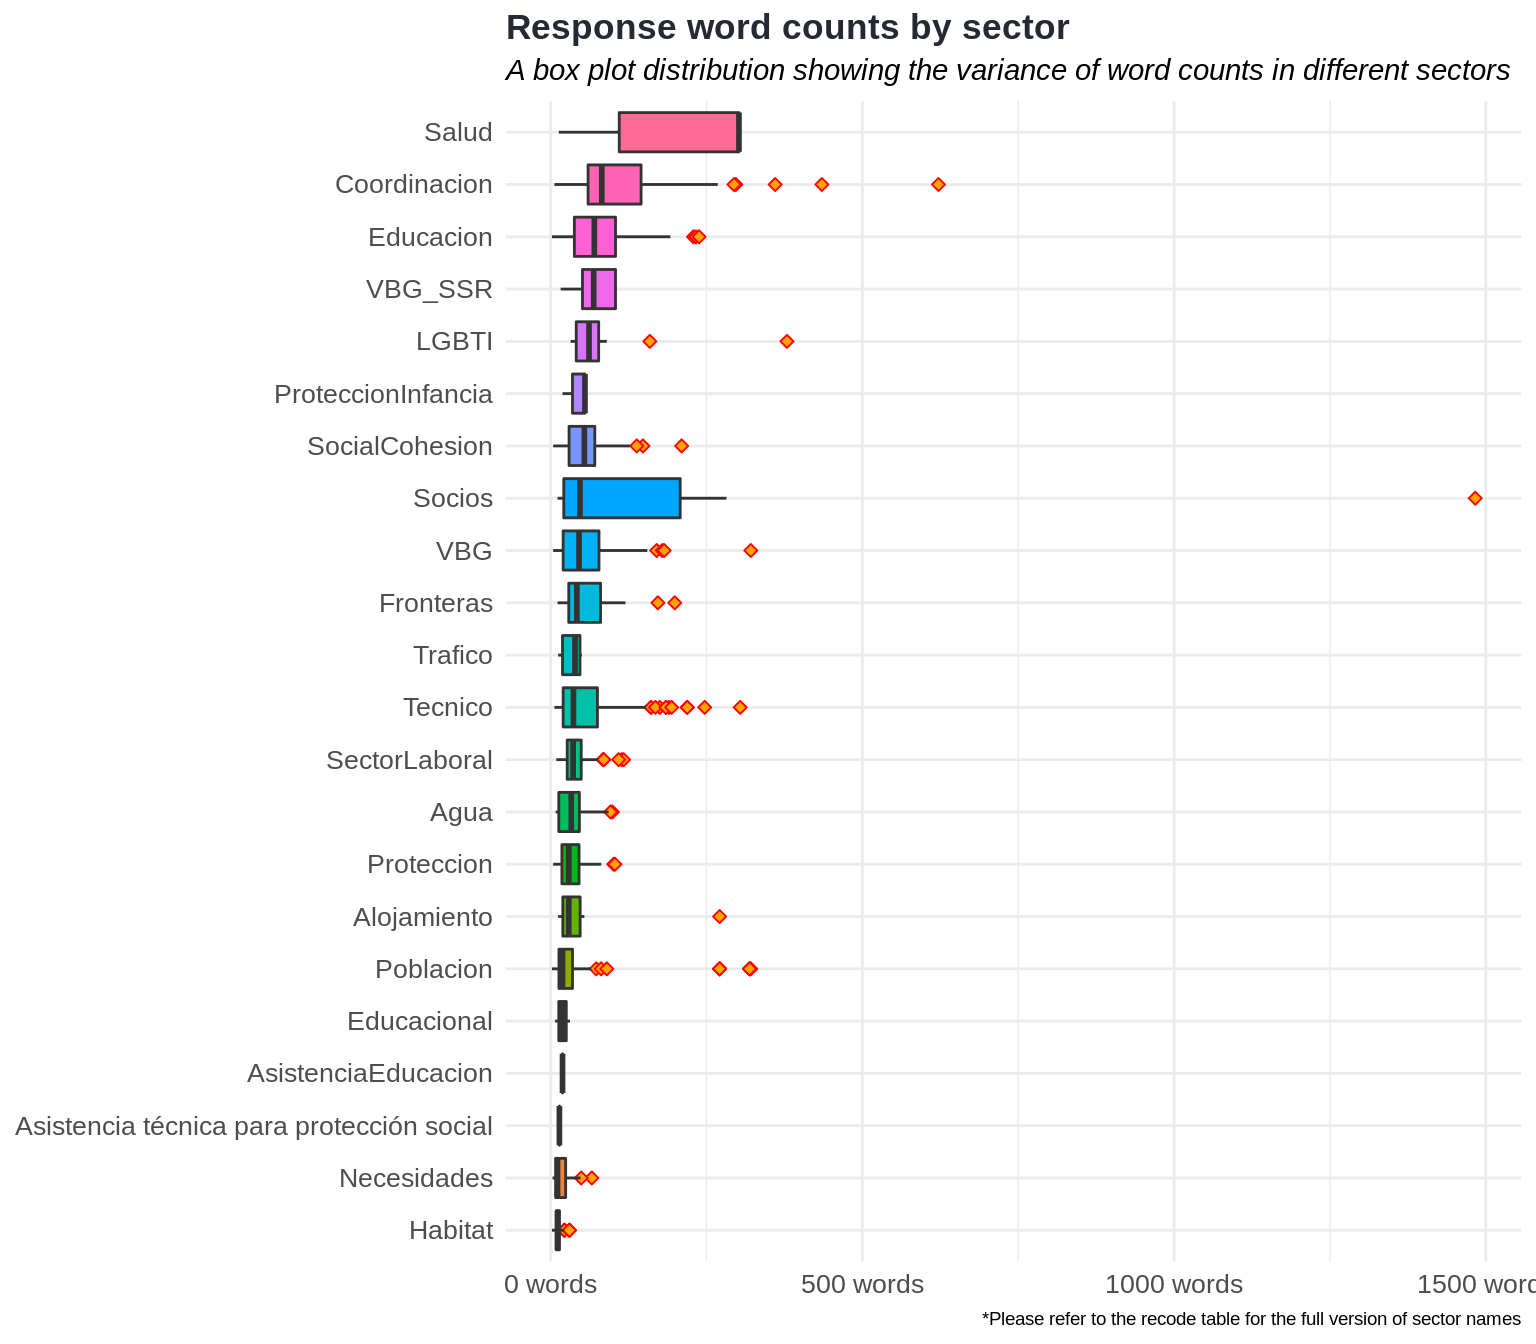
Box plots are commonly used to visualize the measure of spread in the data that gives a clear picture about how the variability and dispersion of the raw data look like.
The boxplot has some characteristics that should be known before diving into the interpretation:
left and right borders of the central rectangle present the first and third quartile values of interquartile range (IQR) respectively;
the line in the middle of the rectangle indicates the median value;
the end of the lines streched from both right and left sides of the central rectangle point the maximum and minimum values;
the orange colored points show the outliers in the data.
Therefore, we see a number of things:
As we have seen in the previous sections talked about the variability and the sample size of the data, the sectors are not equally distributed.
The sector Socios (or long name, Manejo de la información para socios y análisis de las necesidades) has the longest response among all the responses that is 1483 words (please see the recordId: jxyxec3di for more information).
We have looked the average word count in sample sizes in each sector (see the section), therefore the sectors ‘Poblacion’, ‘Tecnico’ and ‘VBG’ have the highest sample size.
The graph shows that these sectors have several outliers, which are very long texts compare to the average.